The Uniqueness of Shooting Data
At the end of 2017, David Bernstein published an article in The Atlantic on shooting data, or rather the lack thereof. Non-fatal shooting data is often difficult to come by because it is generally lumped-in with other types of assault in national data collections. Bernstein notes:
“Fatal gun violence is often categorized in ways that make it easy to track and study. That’s how researchers know that the murder rate in the United States has declined steadily over the past three decades. But what about gun violence that does not result in death? That is far trickier to measure.”
Three Police Data Initiative cities -- Cincinnati, Philadelphia and Rochester -- are helping to fill this knowledge gap by publishing emerging open datasets on shooting victimization in near real-time.
The City of Cincinnati offers publicly available shooting victimization data from 2008 to present through the city’s open data portal. This dataset includes information on when and where a shooting took place, the number of victims, whether the incident was fatal or nonfatal, and information on the race, sex and age of the victim.
The City of Philadelphia’s shooting victim dataset, comprised of data from 2015 to present, provides similar information on shooting victims. An interesting additional aspect of Philadelphia’s dataset is how it breaks down shootings by where they occurred on the victim’s body.
Finally, the City of Rochester provides data on shooting victims, including whether the incident was fatal as well as the race, age and gender of the victim. Impressively, this dataset has data on victims going all the way back to 2000.
These datasets are important and noteworthy for many reasons, but especially because they are incredibly unique. Shooting data can be hard to come by, but this data enables numerous types of analysis. Below are a few relatively simple analyses that I did using publicly available shooting data in these three cities.
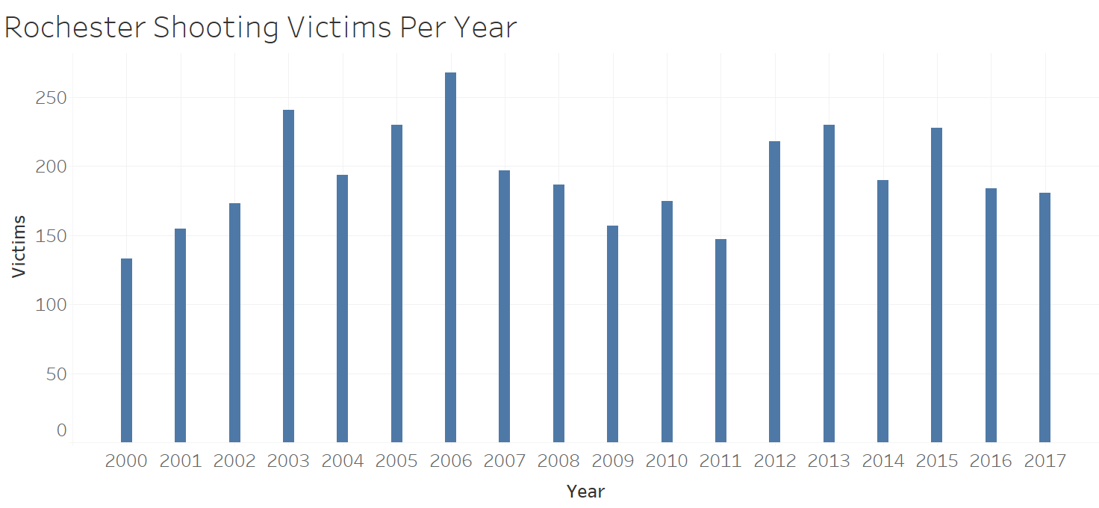
First, since Rochester provides such a long period of data, I was curious as to how shootings have changed in Rochester since the turn of the century. The length of available shooting data could allow anyone to begin to analyze gun violence. The below chart shows shooting victims in Rochester per year since 2000.

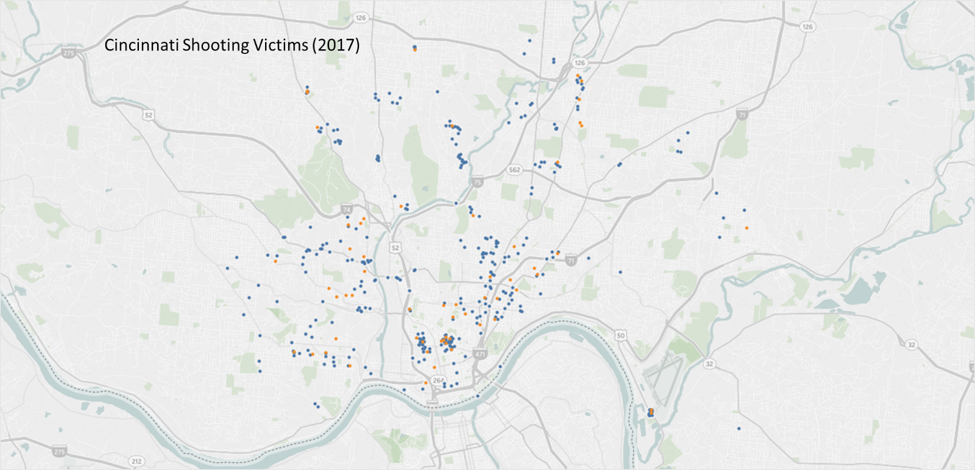
Next, I was interested in determining how geographically concentrated gun violence victimization tends to be in Cincinnati. Here are shooting victims in Cincinnati in 2017 broken down by whether the victim was fatally (orange) or non-fatally (blue) shot which highlights where gun violence is concentrated..

There was also about a 4.5 percent decrease in shooting victims in 2017 relative to 2016. Using the data, one can map the change in shooting victimizations from 2016 to 2017 by zip code and see where shootings are up and down throughout the city.

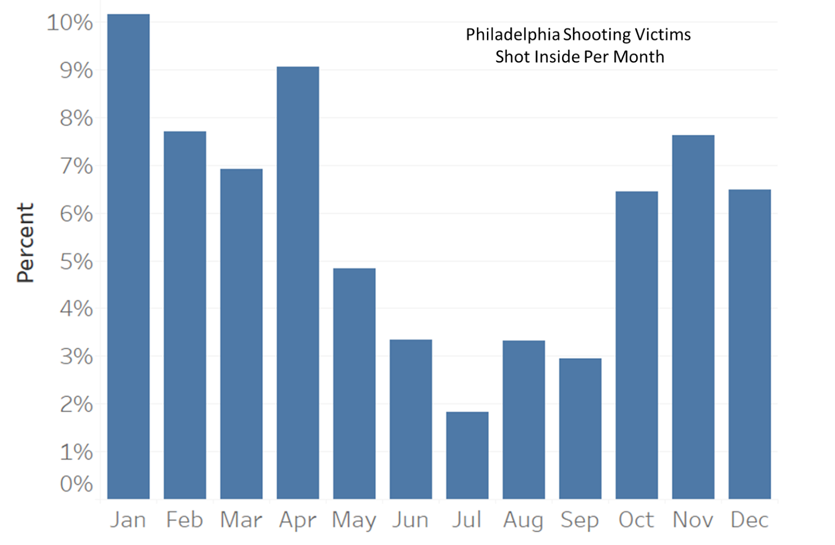
Finally, Philadelphia’s shooting data also enables multiple analyses thanks to the richness of detail provided. For example, the data shows that the vast majority of shootings in 2016 and 2017 in Philadelphia have occurred outside (94 percent) but shootings that occured inside during this time period were more deadly than those that occurred outside (9 percent inside versus 5 percent outside).

Charting victimization over time shows how the percent of shootings that occur inside changes over time as the weather gets warmer and colder. Nearly all shootings occur outside when the weather is nice over the summer, but colder winter weather usually means a higher percentage of shootings occurring inside.

Conclusion
What makes these three datasets so impressive is a combination of their uniqueness and their potential importance. There is no legal mandate to collect shooting statistics. These cities not only collect such information, but they publish it for public consumption.
Understanding what may be driving changes in gun violence can be critical for a city and measuring that violence is the first step in addressing gun violence. These three cities provide a framework for how publishing unique datasets can help solve critical civic issues.
Are you sharing data that can support disaster response and recovery? Tell us more at PDI@policefoundation.org or find us on Twitter at @PoliceOpenData
